AIR Scientists Harness Solar-Induced Chlorophyll Fluorescence for Cotton Yield Prediction
Nov 09, 2023
Scientists from the National Engineering Research Center for Satellite Remote Sensing Applications, Aerospace information Research Institute (AIR), Chinese Academy of Sciences (CAS), together with collaborators from Shihezi University (Xinjiang, China), harnessed solar-induced chlorophyll fluorescence as a potent indicator for predicting cotton yields, and achieved significant advancements in the realm of mid-season cotton yield forecast in Xinjiang.
This study entitled "Regional-scale cotton yield forecast via data-driven spatio-temporal prediction (STP) of solar-induced chlorophyll fluorescence (SIF)" has been recently published in Remote Sensing of Environment.
Based on the team’s previous work regarding “10-meter-resolution Cotton Map in Xinjiang, China", they further explored the feasibility of the spatio-temporal prediction products of SIF (STP-SIF) on cotton yield forecast using multi-source remote sensing data, including Sentinel-2 imagery and multi-scale satellite SIF products. They first proposed the STP-SIF issue (Figure 1), explored the potential driving mechanism, and designed time-series data-driven deep learning approaches (Figure 2). And then they generated the STP-SIF products and examined their performance on the cotton yield forecast in mid-season.
The results showed that the proposed methodology achieved high performance on forecasting cotton yields in the mid to late growing seasons. The best cotton yield prediction accuracies (Figure 3), with R2 of 0.70 and 0.66 for one and two months before harvest, were obtained respectively by the combination of the known SIF and NDWI (Normalized Difference Water Index) and the predicted SIF.
This study, for the first time, explored the STP-SIF issue and preliminarily showed its little spatial scale dependence. This study offers a baseline for the STP-SIF issue and reveals the feasibility of the STP-SIF products for accurate crop yield forecast.
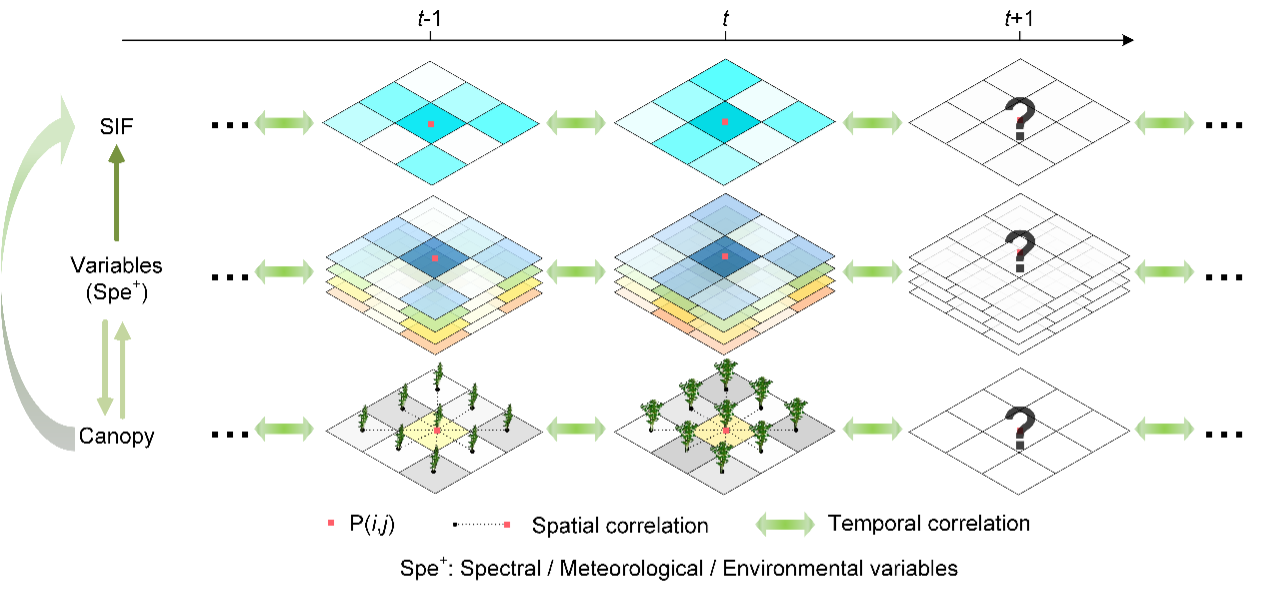
Figure 1. A schematic diagram of STP-SIF. (Image by AIR)
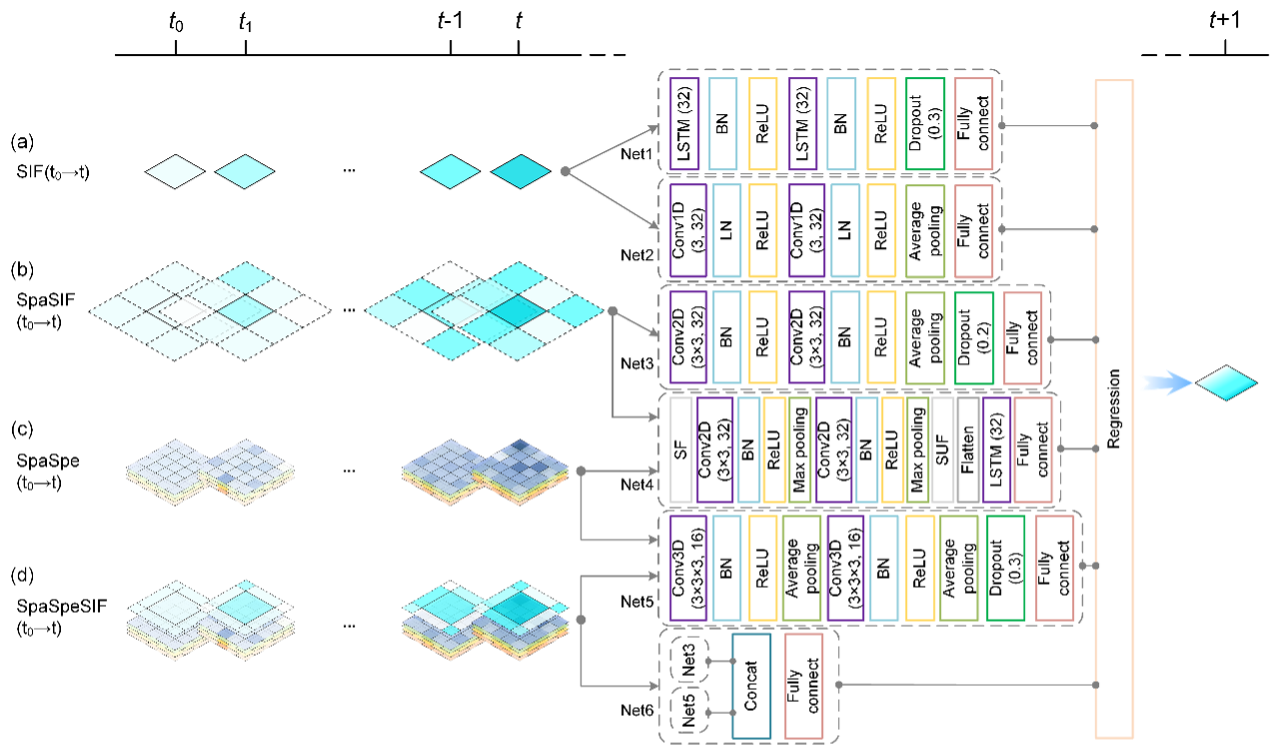
Figure 2. Details of the designed network structures for various data styles. (Image by AIR)

Figure 3. Cotton yield mapping one to two months before harvest (a and b are two months before harvest; c and d are one month before harvest).(Image by AIR)
Contact: luyq@aircas.ac.cn
News & Events