Satellite Observation Reveals Changes in Vegetation Greenness Related to Climatic and Non-Climatic Factors in Sudano-Sahelian Region of Africa
Jul 14, 2023
Information on vegetation dynamics and potential drivers in the Sudano-Sahelian region of Africa is crucial for a better understanding of long-term changes and sustainable management of dryland ecosystems. However, recent trends in vegetation greenness may not be fully explained by rainfall, which is regarded as the primary climatic driver, and other potential non-climatic drivers such as land use/land cover (LULC) and fires need to be further explored.
A study published in Regional Environmental Change analyzed trends in vegetation greenness at the pixel scale using time series of satellite data in the Sudano-Sahelian region during 2001-2020 and quantified the relative contributions of climatic factors and non-climatic factors in specific sub-regions.
This work is carried out by the EOWATER team from the State Key Laboratory of Remote Sensing Science under the Aerospace Information Research Institute (AIR), Chinese Academy of Sciences (CAS).
Using MODIS NDVI as a proxy for vegetation greenness, they found that greening was widespread across the Sudano-Sahelian region, while browning was clustered in central West Africa (Figure 1a). They applied a correlation-based conceptual attribution model to study rainfall-driven changes. The results showed that only nearly half of the areas with vegetation greening could be explained by long-term rainfall variability, while most of the areas with browning trends were not related to rainfall variability (Figure 1b). They found that greening/browning vegetation trends not caused by rainfall variability could be explained by the the non-climatic factors, e.g. LULC change and fire impact.
LULC changes have significant local effects on vegetation greenness in specific sub-regions of the Sudano-Sahelian (Figure 2). By analyzing the fractional abundance of LULC classes within each NDVI pixel and using a relative importance approach, this study found that gains (i.e., increases in the fractional abundance of LULC classes) in cropland and natural vegetation associated with positive land management were likely the dominant drivers of greening in Senegal and Ethiopia (Figure 2a and c). The combined impacts of rainfall variability and LULC changes contributed to greening trends in Mali and Sudan (Figure 2g and i). In contrast, vegetation browning in central West Africa appeared to be driven by cropland gain and natural vegetation loss (i.e., decrease in the fractional abundance of a LULC class) associated with extensive agricultural production activities (Figure 2d-f), suggesting that more attention should be paid to sustainable natural resource management in this region in the context of continued population growth. In addition, this study found that repeated fires for agricultural expansion in central West Africa are intensifying the browning of vegetation (Figure 3).
These results advanced our understanding of vegetation dynamics in response to climatic and non-climatic factors in Sudano-Sahelian drylands, which are characterized by increasing pressure on land resources.
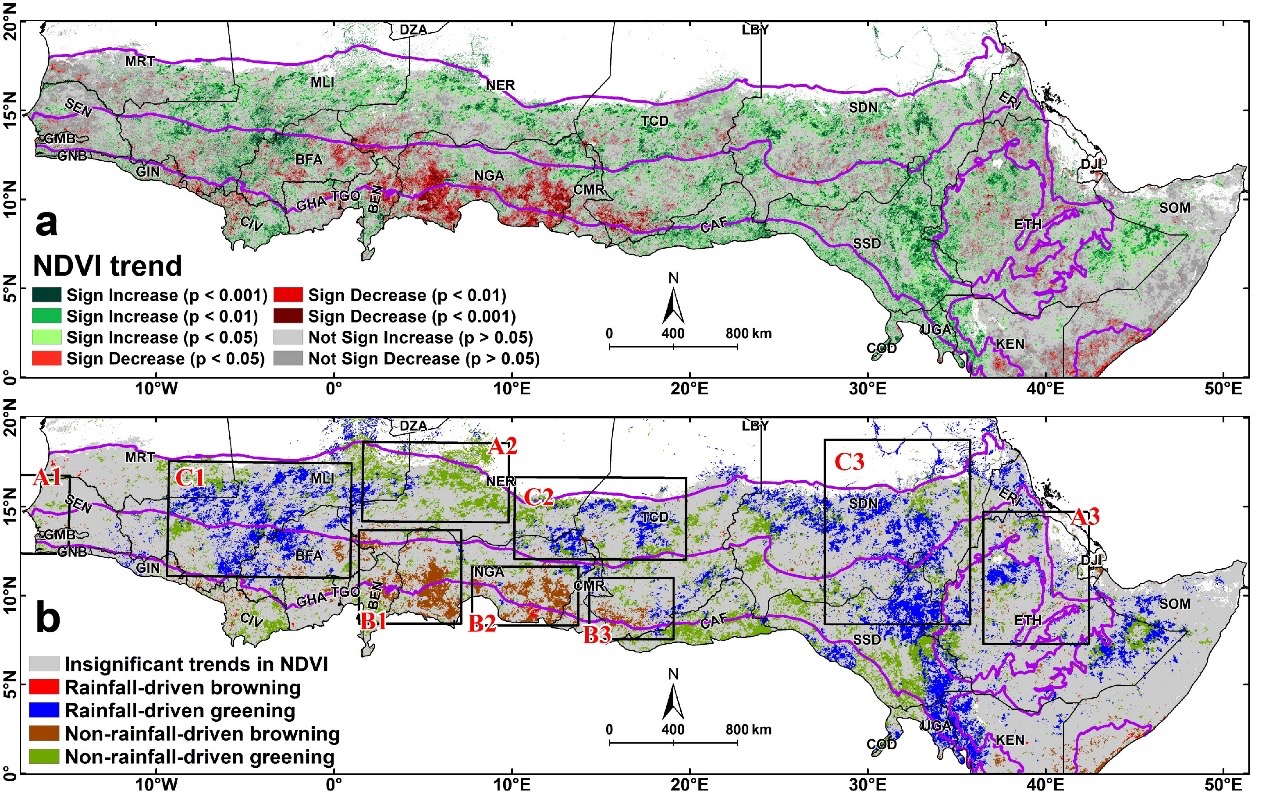
Figure 1 (a) Trends in annual mean NDVI; (b) Rainfall-driven attributions of NDVI trends. Gray areas show insignificant trends (p≥0.05). The black boxes in (b) are the nine hotspot sub-regions selected to analyze the impacts of potential drivers on vegetation greenness trends, including non-rainfall-driven greening clusters (A1: Senegal; A2: central Niger; A3: Ethiopia), non-rainfall-driven browning clusters (B1: Benin-Niger-Nigeria; B2: eastern Nigeria; B3: southern Chad), rainfall-driven greening clusters (C1: western Sahel (Mali and western Burkina Faso); C2: western Chad; C3: Sudanian savannah (Sudan and South Sudan)). (Image by AIR)
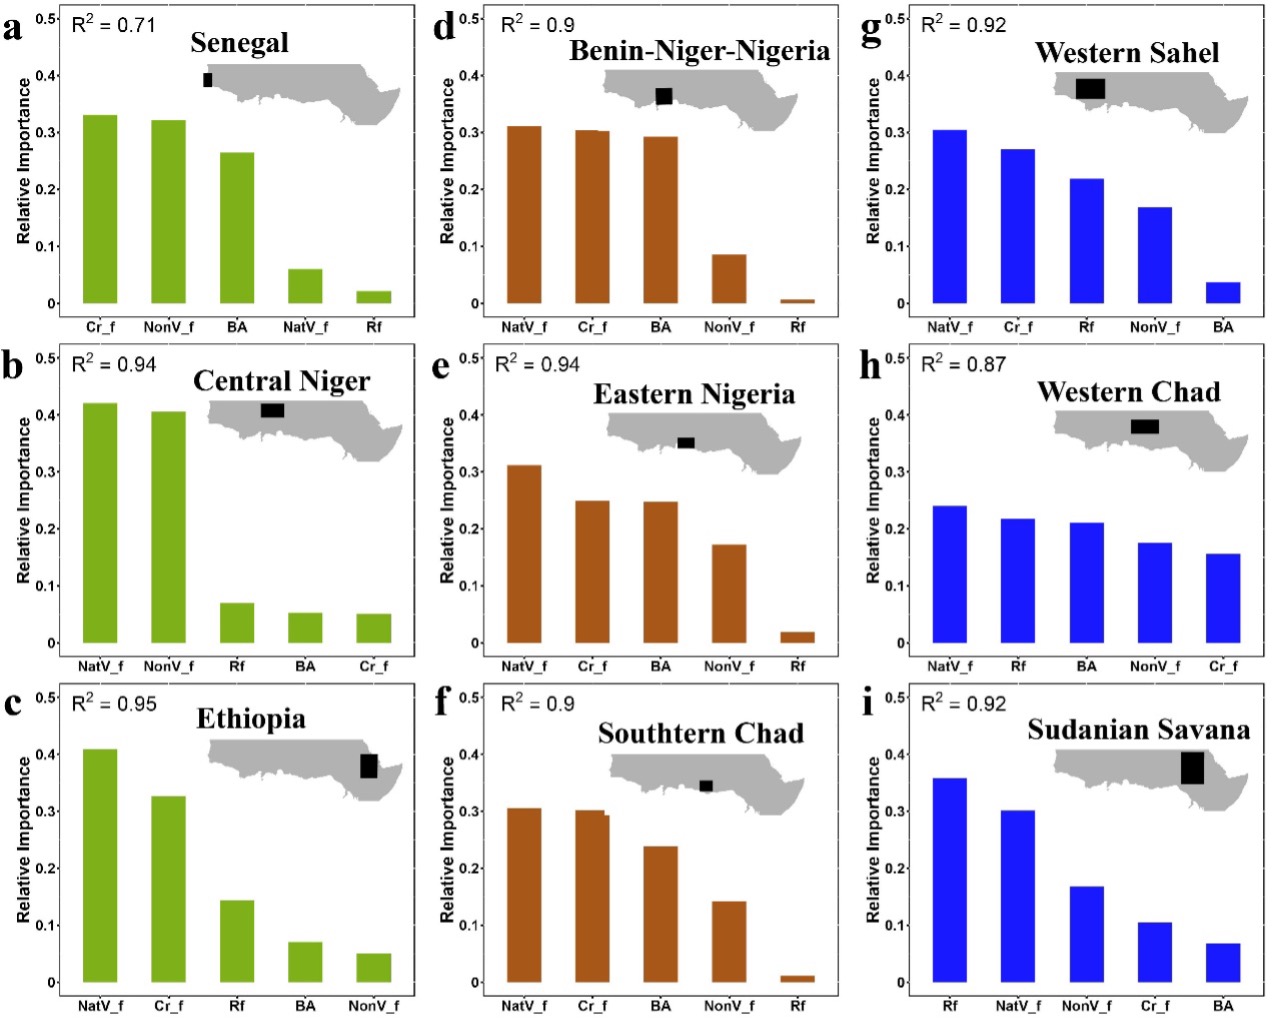
Figure 2 The relative importance of rainfall variation (Rf), change in cropland fraction (Cr_f), change in natural vegetation fraction (NatV_f), change in non-vegetation fraction (NonV_f), and change in burned area (BA) to the NDVI anomalies (Z-score of NDVI) within (a-c) non-rainfall-driven greening clusters, (d-f) non-rainfall-driven browning clusters and (g-i) rainfall-driven greening clusters in the Sudano-Sahelian region during 2001–2020. R2 in the figures is the coefficient of determination of the multiple linear regression between the Z-score of NDVI and the Z-scores of the five factors. (Image by AIR)
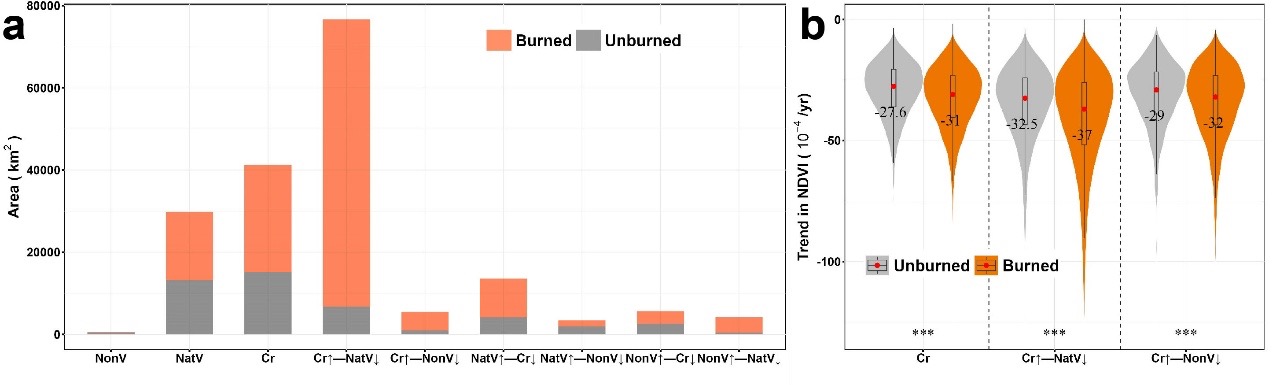
Figure 3 The combined impacts of LULC changes and repeated fires on vegetation greenness for non-rainfall-driven browning clusters in the sub-regions of central West Africa. (a) The area of unchanged/changed LULC classes with burned and unburned situations. (b) The violin diagrams of NDVI trends in agricultural areas with burned and unburned situations. The red dots and numbers in the violin diagrams represent the median values of NDVI trends. (Image by AIR)
Contact: luyq@aircas.ac.cn
News & Events