Heat Extremes on the Rise: Climate Study Finds
Temperature extremes with altered characteristics are one of the most threatening impacts of global warming. However, how their characteristics have changed is uncertain, and varies by region. A research article recently published in Communications Earth & Environment, a journal from Nature Portfolio, provided for the first time a panoramic view of global patterns and trends of Temperature Extreme Events (TEEs) with both heat and cold extremes considered, of heat vs. cold extremes, and of compound TEEs.
This article titled “Growing prevalence of heat over cold extremes with overall milder extremes and multiple successive events” is authored by the research team led by Prof. LI Qiangzi from National Engineering Laboratory for Satellite Remote Sensing Applications, Aerospace Information Research Institute (AIR), Chinese Academy of Sciences (CAS).
The team designed a comprehensive analytical framework to define and measure single and compound TEEs, and to analyze the spatio-temporal patterns and trends of their annual mean frequency, mean event duration, mean event intensity, and annual cumulative magnitude at grid cell, regional and global scales over the period 1980-2018.
It was found that over the study period, the magnitude of heat extremes significantly increased at 3.06°C decade-1, while that of cold extremes decreased at -4.76 °C decade-1, on global average. Consequently, the world had transformed rapidly and steadily from a cold-extreme- to a heat-extreme-prevailing climate. Contrary to general belief, TEEs as a whole had become significantly milder globally with a decreasing rate of -1.63°C decade-1, due to the faster decrease in cold extremes compared to the increase of heat extremes. The compound percentage had marginally, yet significantly decreased by 0.87% per decade.
Overall, these trends were not globally uniform. the Middle East and North Africa, including the Mediterranean region, stood out as a hotspot of shift towards a heat-extreme-prevailing climate, with fast and significant heat extreme increase and cold extreme decrease. As a result of global heterogeneity, different patterns and trends were identified among climate zones, and the most noteworthy is in the Tropical and Polar zones.
The shift towards a heat-extreme-prevailing climate regime was the fastest in the Tropical zone, due to the fast percentage changes of both heat and cold extremes in magnitude. The Tropical zone was also associated with the most rapid increase of compound TEE percentage. Unlike global trends, TEEs as a whole had become slightly more severe in the Tropical zone, though not significant. Conversely, TEEs had become significantly milder, and the climate regime shift was the slowest in the Polar zone due to the lowest percentage changes of heat and cold extremes. The globally dominating trend of increasing heat extremes and decreasing cold extremes was the most uncommon in the Polar zone, with only 55% covered by such trends, in contrast to >80% in other climate zones.
The comprehensive study by Prof. LI Qiangzi, Dr. ZHANG Yuan and their colleagues revealed greater spatial details and heterogeneity of TEE trends and distribution by adopting the high spatio-temporal resolution ERA5 data. Their analytical framework (including TEE definition, classification, extraction, metrics, and analysis) is a pioneer effort towards the establishment of a unified framework to measure and analyze TEEs.
The enhanced understanding of global and regional TEE patterns and trends can provide new insights to support more oriented, effective and localized adaptation to climate change.

Global distribution and trends of annual mean frequency (F), mean event duration (D), mean event intensity (I), and annual cumulative magnitude (M) for all identified Temperature Extreme Events (TEEs). a-d Global distribution of F, D, I, and M. e-h Global trends of F, D, I, and M.
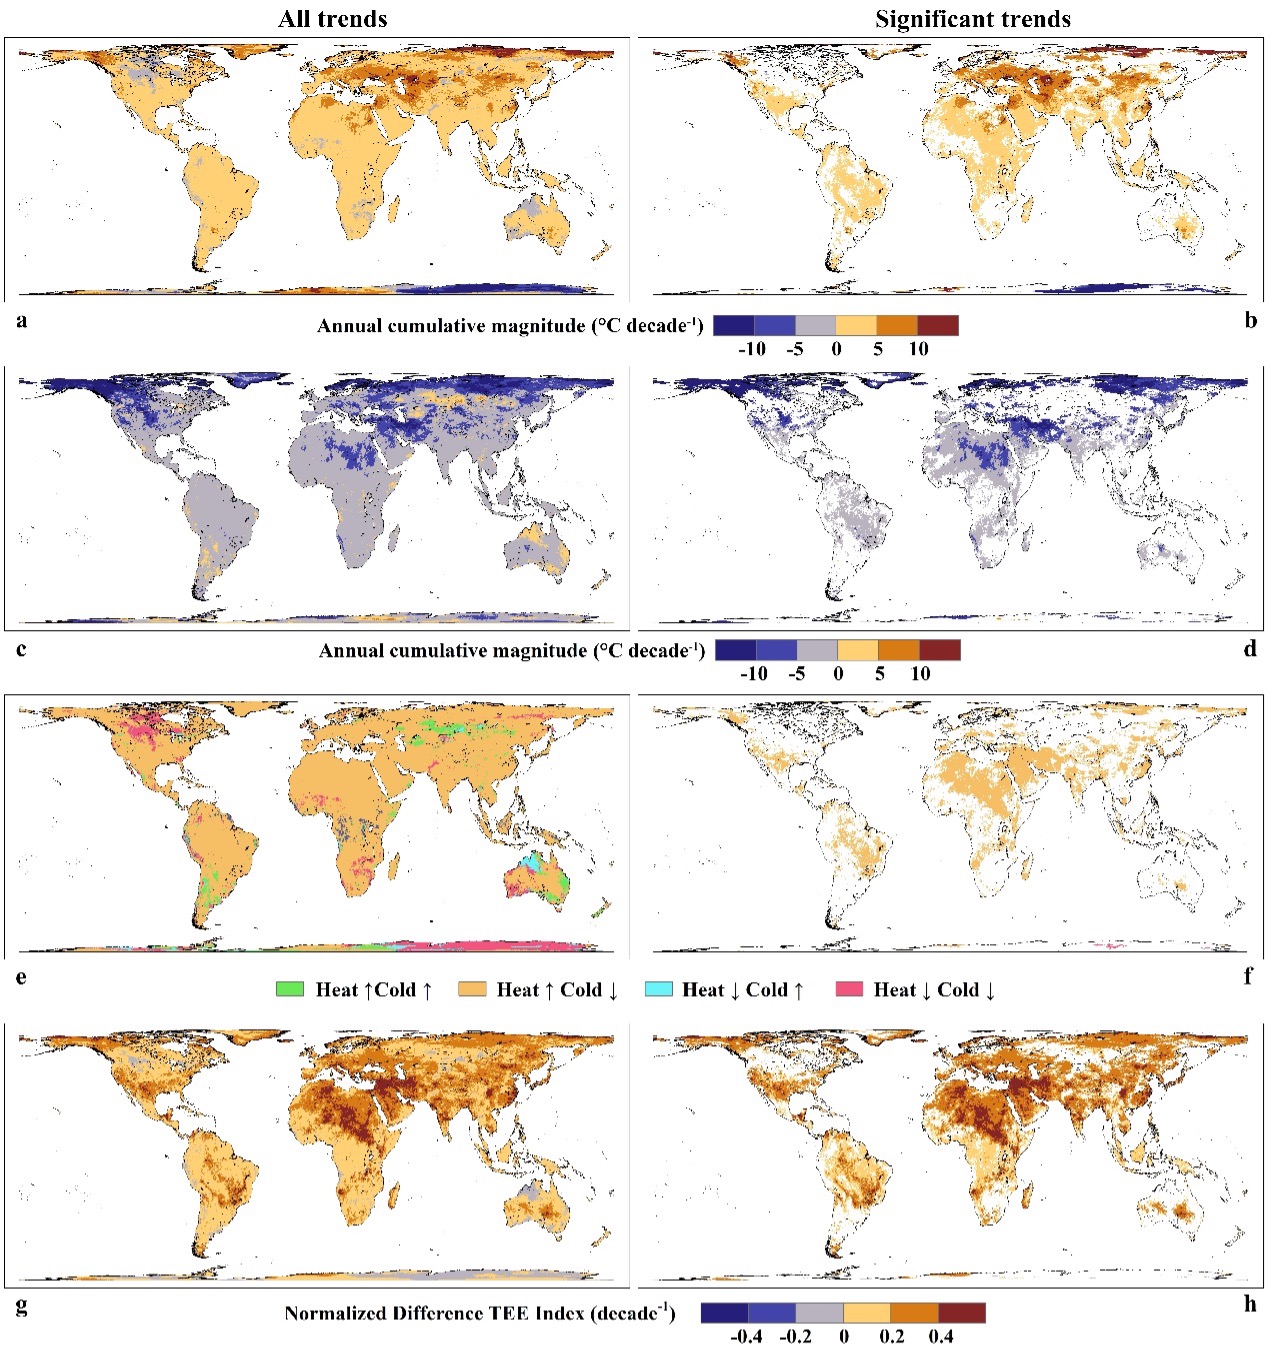
Global distribution of temporal trends for heat and cold extremes. a, b Trends of annual cumulative magnitude (M) for heat extremes. c, d Trends of M for cold extremes. e, f Classes of trend combinations. g, h Trends of Normalized Difference TEE Index (NDTI). Trends were estimated for 1980-2018 using Mann-Kendall test and Theil-Sen method, and b, d, f, and h show only significant trends at the 5% level.
News & Events